IR Spectroscopy
Creates conformational changes in molecules with varying polarity
- Is useful for identification of molecular structure, however is limited to identification of functional groups and “fingerprinting”
- Is highly limited by its likelihood of being interfered with
Typical Spectrum
- Measured as transmittance (peaks going down from 100%) instead of absorbance
- Wavelength measured in \(\bar{\nu}=\frac{1}{\lambda (cm)}\)
Types of IR
- Near-IR - Photometry/spectrophotometry similar to UV-VIS - quantification of organo-macromolecules
- Mid-IR - Surface analysis, reflectance/diffuse reflectance/photoacoustic
- Far-IR - Quantification of functional groups containing C, H, O rather than compound identification
FTIR
- measures an interferogram and uses FT to convert it to a spectra
- IR radiation is primarily thermal energy and induces stronger molecular vibrations within bonds
- Bonds act as springs, even with their own spring constant (see later)
Types of molecular interactions
Rotational
- Rotational transitions occur in the far-IR range (lower energy) at \(<100\:cm^{−1}\)
- There are far more rotational transitions than vibrational transitions and only small amounts of energy are required to trigger them *This however means that they only are really observed in gasses
Vibrational
- Vibrational modes are higher in energy and come in bond length and atom rotational forms.
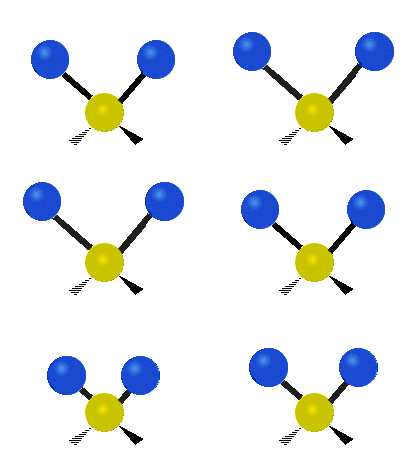
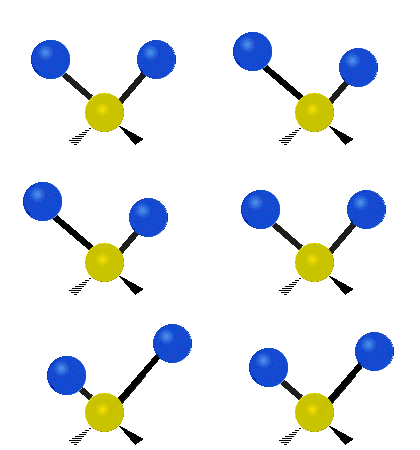
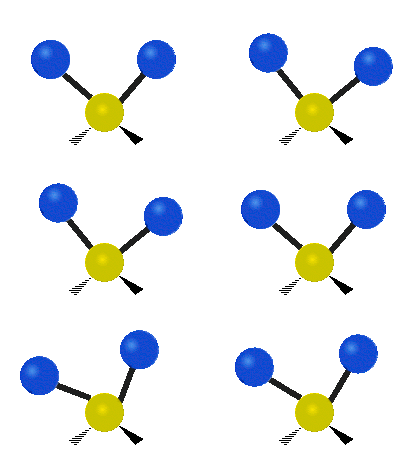
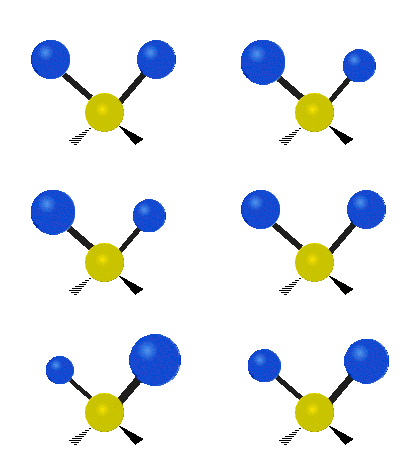
- Each mode is given a Greek letter to denote it’s behaviour
Radial
| Symmetrical Stretching - \(\nu_s\) | Asymmetrical Stretching - \(\nu_{as}\) | |
|---|---|---|
Latitudinal
| Scissoring - \(\sigma\) | Rocking - \(\rho\) |
|---|---|
Longitudinal
| Wagging - \(\omega\) | Twisting - \(\tau\) |
|---|---|
Peak height
- Peaks can be (depending on their height):
- Weak (w) - <30%
- Medium (m) - 30−60%
- Strong (s) - >60%
- This is dependent on the polarity of the bond in question. The more polar the bond, the higher the absorbance at that peak.
Peak width
- Peaks can also be:
- Broad - wide and smooth * Typically seen in O-H bonds (water!)
- Narrow - thin and pointy
- This is caused by resolution limitations causing multiple absorbance peaks to blend into the one curve
- This is dependent on the amount of excitation states for the particular bond
Polarity
- Only polar bonds will be active, as they need to be able to change their dipole when they rotate or vibrate
- The movement of atoms causes a shift in the electron density and thus a shift in the bond’s dipole
- As a result pure covalent bonds will not show up, such as \(\ce{O2, N2, H2}\) etc.
- \(\ce{CO2}\) and \(\ce{H2O}\) are still envirnmental interferants however.
Symmetric bonds
- If a bond has polarity but the molecule is symmetric, the resulting dipole will not move either, causing there to be no identifiable change
- Strong * Strongly Polar bonds
- Medium * Medium polarity bonds * Asymmetric bonds
- Weak * Weakly polar bonds * Symmetric bonds
- Symmetric molecules will also show a more simple spectra, as the bonds will be duplicated, since they’ll be in the same environment and will overlap in their absorbance.
Coupling
- If vibrations occur around a central atom, the effect of their shift may not cause a net change in the dipole
- This is likely when:
- The have a common atom in stretching modes
- They have a common bond in bending modes
- They have a common bond in bending and stretching modes
- They have similar vibrational frequencies
- This is unlikely when
- The atoms are separated by two or more bonds
- The symmetry is inappropriate
Electron density
- When an EDG contributes more density to a bond, it gets stronger and as a result will take more energy to excite the group
- The opposite is true for EWGs
- E.g. \(\ce{C-O}\) bond in:
- Methanol - \(1034\:cm^{−1}\)
- Ethanol - \(1053\:cm^{−1}\)
- Butanol - \(1105\:cm^{−1}\)
Anharmonic oscillation
- The vibrational modes of bonds is dependent on the amount of energy put in. The process follows the Morse Potential pattern
- Too much energy and the bond will break
- The bond will get significantly longer rather than compressing significantly
- This is due to a Coulombic effect as well harmonic oscillation
Diatomic formula
calculates where peaks appear
Where:
- \(m_1\) and \(m_2=\) the masses of the atoms
- \(k=\) the sprinc constant (Hooke’s law)
- \(\mu=\text{reduced mass}=\frac{m_1m_2}{m_1+m_2}\)
\[
\bar{\nu}=\frac{1}{2\pi c}\big(\frac{k}{\mu}\big)^{\frac{1}{2}}=130.3\big(\frac{k}{\mu}\big)^{\frac{1}{2}}
\]
\(k\) can be obtained from the following table
| \(\ce{O\bond{-}H}\) | \(\ce{C\bond{-}H (sp^3)}\) | \(\ce{C\bond{-}H (sp^2)}\) | \(\ce{C\bond{=}O}\) | \(\ce{C\bond{#}C}\) | \(\ce{C\bond{=}C}\) | \(\ce{C\bond{-}C}\) | \(\ce{C\bond{-}O}\) |
|---|---|---|---|---|---|---|---|
| 780 | 480 | 510 | 1210 | 690 | 760 | 540 | 450 |
Peak count
- To determine the amount of peaks we’d expect to see, we can use the following formula, which utilises the degrees of freedom for a molecule to determine what is possible
- Where \(N=\) number of atoms:
\[
\text{Linear molecule - }3N−5
\]
\[
\text{Non-linear molecule - }3N−6
\]
- Each vibration is called a normal mode and has a characteristic frequency
- This will give the maximum number of fundamental peaks
Fewer peaks
Fewer peaks may be observed due to:
- Symmetry of the molecule causing cancellations
- Similar bonds sharing energy
- Low absorption intensity
- Energy of peak being out of the range of the spectrophotometer
More peaks
- Harmonics of the fundamental frequency can cause overtones at multiples of the fundamental frequncy
- uncommon but possible
- occurs when an excitation happens from ground state to the second excited state (\(\ce{v=0 -> v=2}\))
- When multiple vibrational modes are excited by a single photon, either the sum of the two modes or the difference can be seen as a result
Example - \(\ce{CO2}\)
- Has \(3N−5=4\) vibrational modes
- Actual peaks:
- Symmetric stretching will result in no net change of the dipole
- Asymmetric stretching will result in a net change and thus a peak
- The two bending modes will have the same energy and thus will show up as a single peak
- Thus only two peaks are observed, not the expected four


